The Entry Exit Timer is not a buy/sell arrow indicator, and the fastest way to get value out of it is to stop treating it like one. It is a timing layer. It bolts on top of whatever strategy you already trade — SMC, supply and demand, ICT, plain support and resistance, an RSI system — and answers one narrow question: is right now a good price for the trade you already decided to take?
Your analysis tells you where. This tells you when. That gap between the two is where most losing trades actually live.
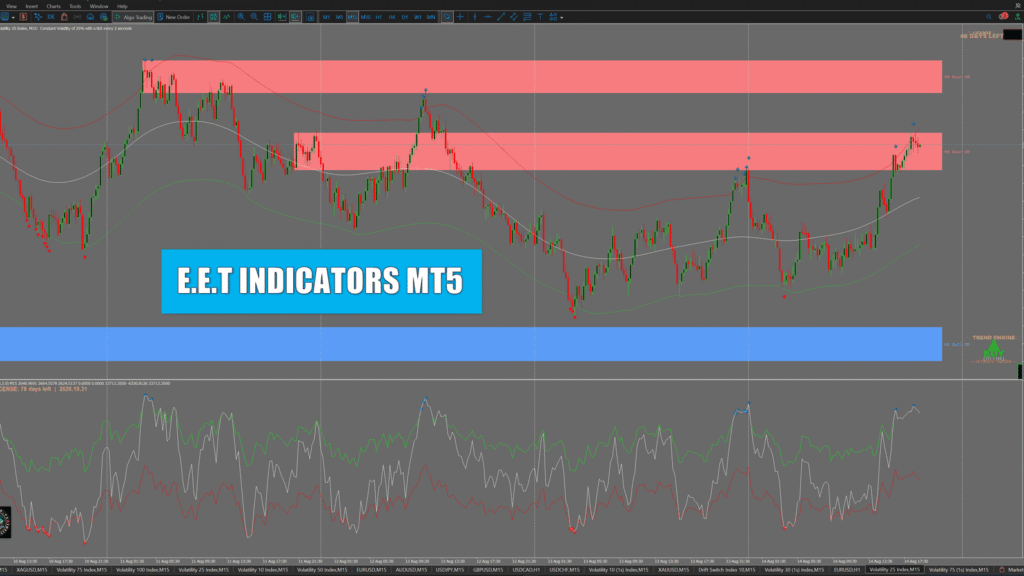
This package contains both builds: the main-window indicator that draws on your price chart, and the second-window oscillator that reads the same stretch as a multi-timeframe gauge.
Watch the full breakdown
How the bands work
The centreline is a Triangular Moving Average, not a normal one. It weights bars heaviest at the centre and tapers in both directions, which produces the smoothest fair-value read you will get out of price. Default HalfLength is 50, so the full window is 101 bars.
The outer lines are not Bollinger Bands, and that difference is the entire reason the tool works. Bollinger takes one standard-deviation number and mirrors it on both sides, so the envelope stays symmetrical even when the market clearly isn’t. This runs two separate deviation engines instead — one accumulating only bars that close above the centreline, one only bars that close below.
When price pushes above fair value the upper engine takes that energy in and the upper band expands, while the lower engine starves and contracts toward the centreline. That is the elastic part, and it means the shape of the envelope is already a bias before any arrow prints. Wide upper band with a tight lower band tells you this market has been extending upward with real force and has not been rewarding downside.
At the default deviation of 3, reaching the upper band means one specific thing: price is now statistically stretched, in this direction, relative to how this market has behaved over the last hundred bars. That is premium. The lower band is discount. It does not mean reverse.
Two arrow engines
The ArrowStyle dropdown is the biggest single switch in the tool, and picking the wrong one for your strategy will make it look broken.
- Default — wick rejection plus pivot. Three conditions must all be true: the candle’s high pierced the band, that candle closed bullish, and the next candle opened higher than the previous open. Price stabbed into extreme premium, closed strong, then opened even higher. At three deviations that is not strength, it’s stretch. This engine is exhaustion-flavoured — use it for reversals.
- Close Outside Band. Ignores wicks entirely. The candle must close beyond the band with at least 50% of its body outside it, adjustable via
BodyOutsidePct. A wick through a band is a rejection; a body through it is displacement — somebody moved size. This engine is breakout-flavoured — use it for continuation.
Default asks “is this stretched?” Close Outside Band asks “is this being driven?”
The second window oscillator
The companion indicator runs in a separate pane and measures how far price sits from the bands, plotted as a multi-timeframe reading of upside and downside stretch. Its overbought and oversold levels are dynamic rather than fixed — they scale off rolling peaks rather than sitting at hardcoded numbers, which is what keeps it readable on Volatility 75 and Boom/Crash where a fixed 70/30 line would be meaningless.
Use it to confirm what the main window is showing. The chart tells you where price is stretched; the oscillator tells you how stretched, and whether the higher timeframe agrees.
Two ways to trade it
1. Timing a reversal off a higher-timeframe zone. Set ArrowStyle to Default because you are hunting exhaustion. Then, standing on your M15 entry chart, set AppliedTimeframe to H4 — the tool now computes bands on H4 data and projects them onto your M15 candles, giving you higher-timeframe premium at lower-timeframe resolution. Wait for three things to stack in the same place: price inside your zone, price at or beyond the band, and an arrow printing. The arrow inside the zone is the trigger, not the zone touch itself. Glance at the trend panel before you commit — if you are shorting and it reads BUY on both H1 and H4, you are fading an aligned trend. Size accordingly.
2. Timing a breakout without buying the fakeout. Flip ArrowStyle to Close Outside Band and push BodyOutsidePct to 70. As price coils under your level both deviation engines starve and the envelope contracts — that squeeze is your pre-condition, and it leaves the tool hair-triggered exactly when you want it. Now watch which candle breaks the level. A long wick through it that closes back inside prints nothing, and that silence is the tool declining to confirm your breakout. A candle closing with 70% of its body outside a contracted band is displacement with real participation behind it. Once you are in and running, the opposite band becomes your take-profit map — when price extends into it and an exhaustion arrow prints, the move has reached statistical stretch.
The arrow that never prints
The highest-value function of this tool is the signal it withholds. Price sits deep inside a zone that looks perfect, and the indicator shows you nothing — no band touch, no arrow, price parked at fair value in the middle of the envelope. That is the tool telling you there is no edge here right now. You are not buying at a discount or selling at a premium; you are transacting at average. A filter’s job is to say no, and the trades you correctly skip never show up in your journal.
Does it repaint?
The arrows do not repaint. Once an arrow prints it is locked permanently — every bar is evaluated exactly once, and the arrow is built only from a fully closed candle plus the open of the next one. An open price never changes. There is no future information in that arrow.
What you will see is an old arrow that looks detached from the band. The arrow didn’t move — the band moved underneath it. Because the centreline reads 50 bars forward, the right edge is computed on a partial window and settles as new candles arrive. Trade the arrow at the right edge as a live locked signal; just understand that historical bands are settled bands.
Settings that actually matter
- ArrowStyle — Default for reversals, Close Outside Band for breakouts.
- AppliedTimeframe — leave on Current to trade your chart, or set a higher timeframe to project its bands down onto your entry chart. H4 bands on an M15 chart is the strongest configuration in the tool.
- BandsDeviations — default 3. Lower gives more arrows, earlier, lower quality. Higher gives fewer, later, higher quality.
- HalfLength — default 50. Bigger is smoother and slower with a longer settling zone.
- TrendTimeframe — default BOTH, meaning H1 and H4 must agree or the panel reads sideways. That disagreement is information.
Specifications
- Platform: MetaTrader 5
- Files: 2 indicators (main window + separate window oscillator)
- Markets: Built for Gold and Deriv synthetic indices; works on Forex, indices and crypto
- Timeframes: All, with multi-timeframe projection
- Signals: Non-repainting, locked on close
- Alerts: Popup, sound and mobile push
- Version: Trial build with on-chart expiry countdown
Installation
Unzip the download, then in MT5 go to File → Open Data Folder → MQL5 → Indicators and copy both .ex5 files in. Restart MT5 or refresh the Navigator panel, then drag each indicator onto your chart. If they don’t appear, they’ve almost certainly landed in Experts or Scripts by mistake.
Free · both MT5 indicators plus install notes · no payment details required
This is a trial build and stops working on its expiry date — the countdown is shown on the chart. For the full version, setups and the rest of the toolkit, join the channel at t.me/Ultimate_Trading_Tools or email binaryscript101@gmail.com.
Trading carries risk. Past performance does not guarantee future results. Nothing here is financial advice.