MT5 TRADING TOOLS
Technical MT5 indicators examine MetaTrader 5 price charts for the Forex market, stock market, and commodities market. Indicators identify the strength and direction of trends, overbought and oversold conditions, and levels of support and resistance. The underlying mathematical models offer an unbiased evaluation of the situation of the market, enabling traders to accept or reject the signals from trading systems. Download and Create Your Own Trading Systems Using These Freee MT5 Indicators.
Correlation Angle MT5 Indicator:
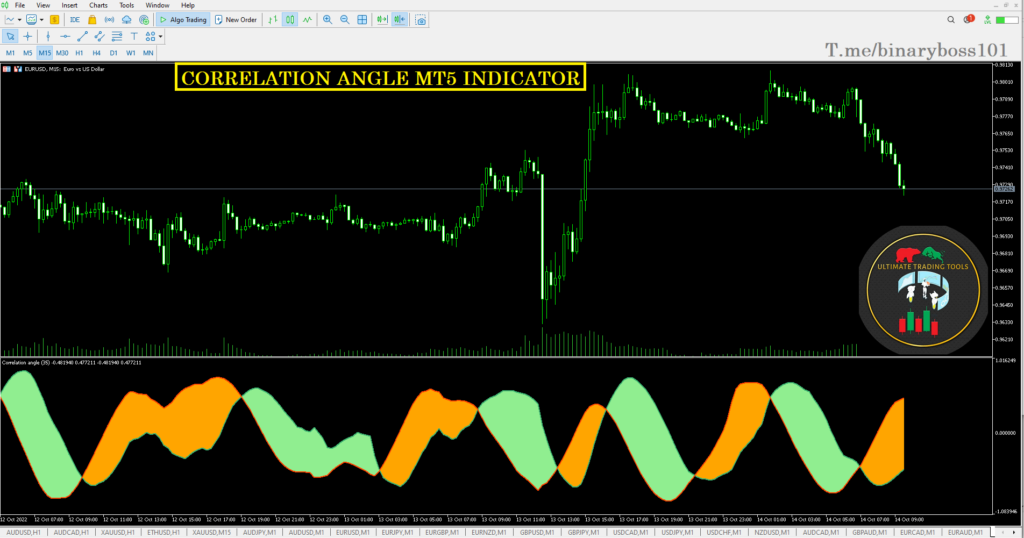
- Platform: Meta-Trader 5
- Supported Pairs: Currencies, Metals, Synthentic Index
- Trading Time : Any Time of Day.
- Time-Frame: 1 Minutes to 4 Hours
- Recommended Broker: Deriv .app/ MT5 Platform?
Regression Channel with variable polynomial Trend MT5 Indicator:
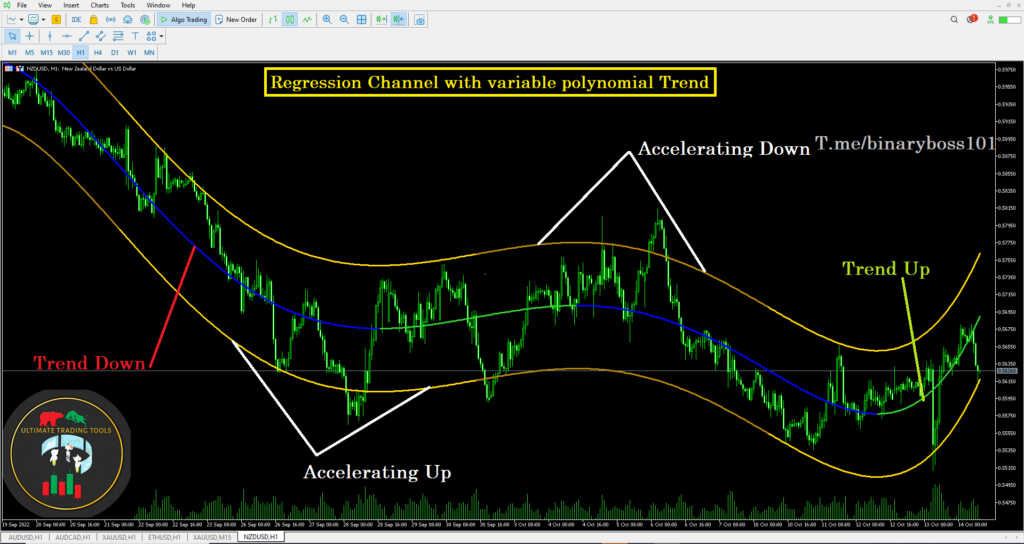
Large institutions, like the 200-day moving average, frequently examine long-term linear regression channels.
A linear regression channel is made up of three components:
Linear Regression Line – The line that best fits all of the data points.
Upper Channel Line – A line that runs parallel to the Linear Regression Line and is usually one to two standard deviations above it.
Lower Channel Line – This line runs parallel to the Linear Regression Line and is typically one to two standard deviations lower.
- Platform: Meta-Trader 5
- Supported Pairs: Currencies, Stocks, Oils, Metals, Synthentic Index
- Trading Time : Any Time of Day.
- Time-Frame: 1 & Above
- Recommended Broker: Deriv .app/ MT5 Platform?
Forex Market Hours GMT MT5 Indicator:
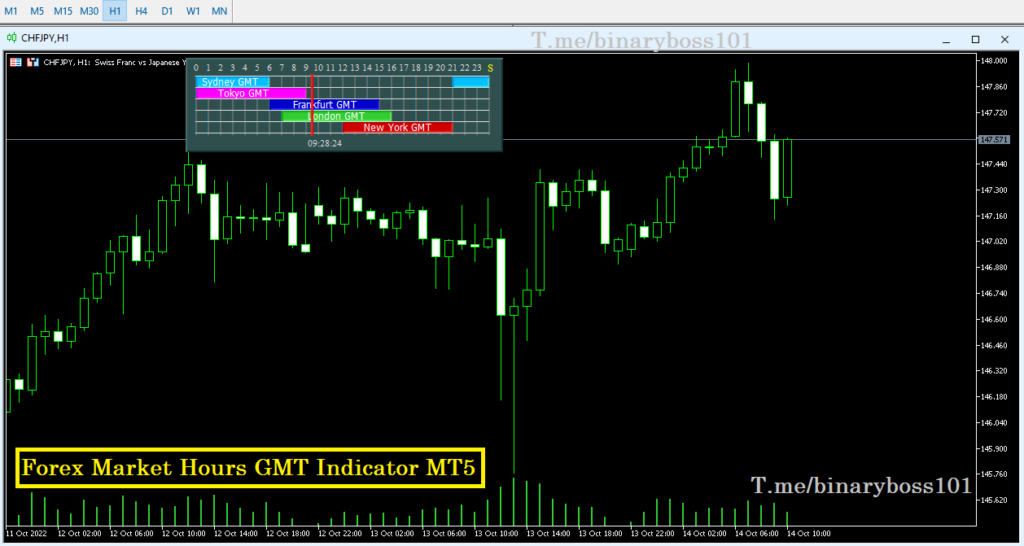
- Platform: Meta-Trader 5
- Supported Pairs: All Forex Markets
- Trading Time : Any Time of Day.
- Time-Frame: Any
- Recommended Broker: Deriv .app/ MT5 Platform?
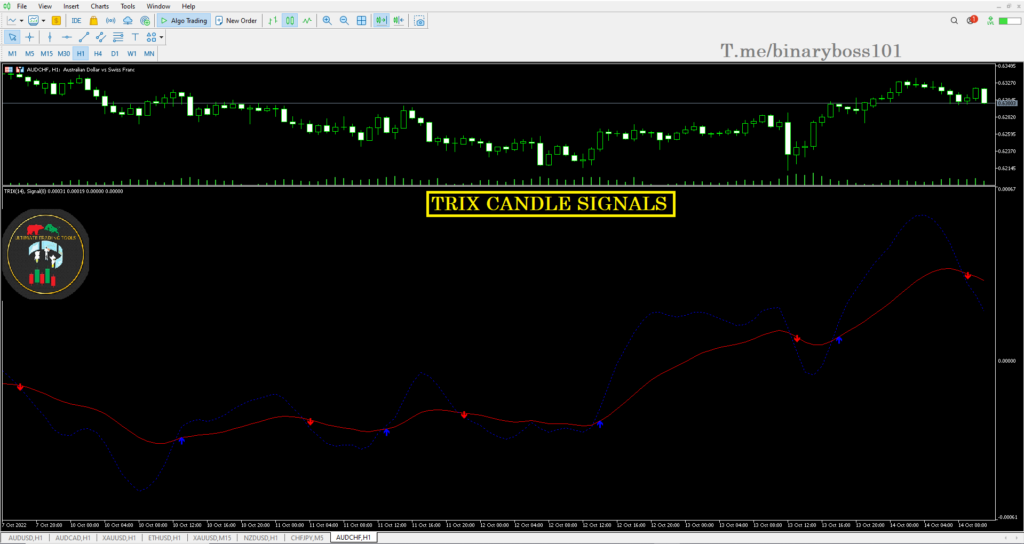
Trix Arrows 2.0 MT5 Indicator:
- Platform: Meta-Trader 5
- Supported Pairs: All Forex Markets & synthentic Index
- Trading Time : Any Time of Day.
- Time-Frame: Any
- Recommended Broker: Deriv .app/ MT5 Platform?
The TRIX Arrows Metatrader 5 indicator is an excellent tool for filtering noise when trading in the Forex market. Spikes or unexpected market fluctuations are the most common cause of losses in forex and index trading. Combining TRIX and TEMA to create a technical trading strategy, on the other hand, provides much better signals for forex and index traders because they use exponential moving averages. The indicator is simple to download and install, and traders can tweak the settings to achieve the best trading results possible.
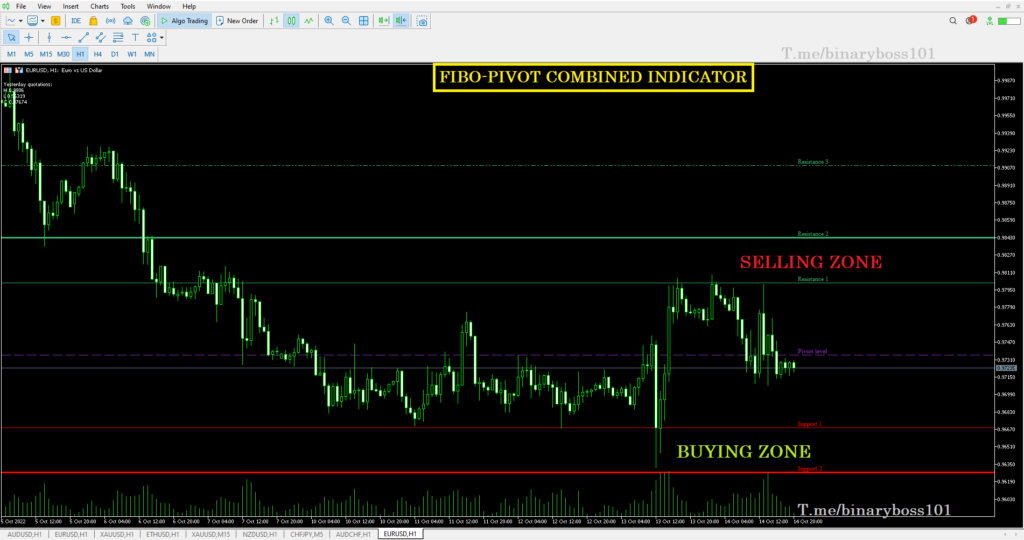
Fibonacci + Pivot MT5 Combined Indicator:
- Platform: Meta-Trader 5
- Supported Pairs: All Forex Markets & synthentic Index
- Trading Time : Any Time of Day.
- Time-Frame: 1 Hour and Above
- Recommended Broker: Deriv .app/ MT5 Platform?
Fibonacci ratios are also essential when it comes to formulating highly relevant support and resistance levels in the markets that trading assets most frequently adhere to – so this indicator is a robust and reliable resource to have when it comes to having key and strong support and resistance zones drawn automatically for all traders. At any given time, there are always a total of seven lines displayed relative to the Pivot points indicator – the fundamental pivot line is purple, the support lines are found below the main pivot line, which is red, and the three green resistance pivot lines are found above the main purple pivot line. Download For Free & Test for Your-self.
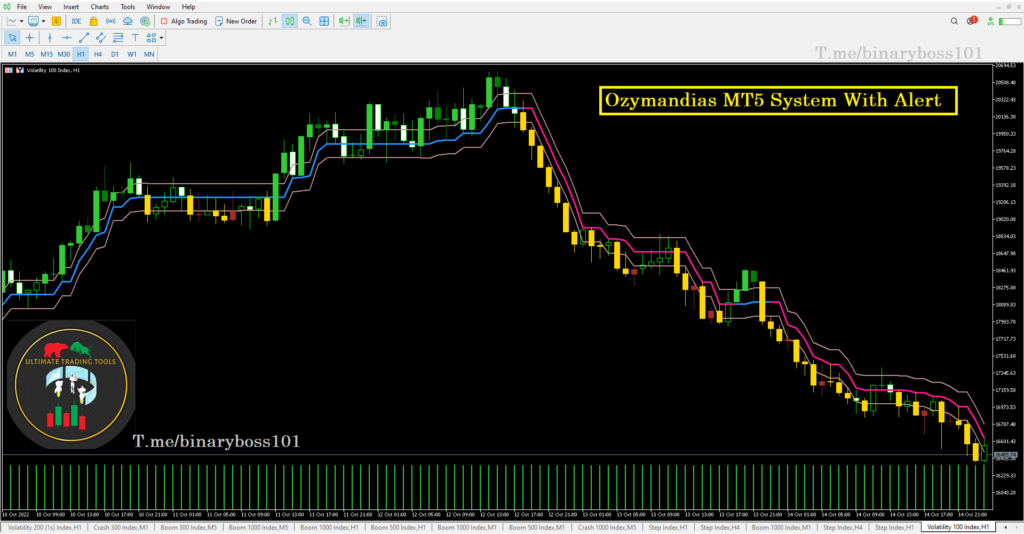
Ozymandias MT5 System With Alert:
- Platform: Meta-Trader 5
- Supported Pairs: All Forex Markets & synthentic Index
- Trading Time : Any Time of Day.
- Time-Frame: 1 Hour and Above
- Recommended Broker: Deriv .app/ MT5 Platform?
- Double Click to Load & Attach the Indicator on MT5 Platform.
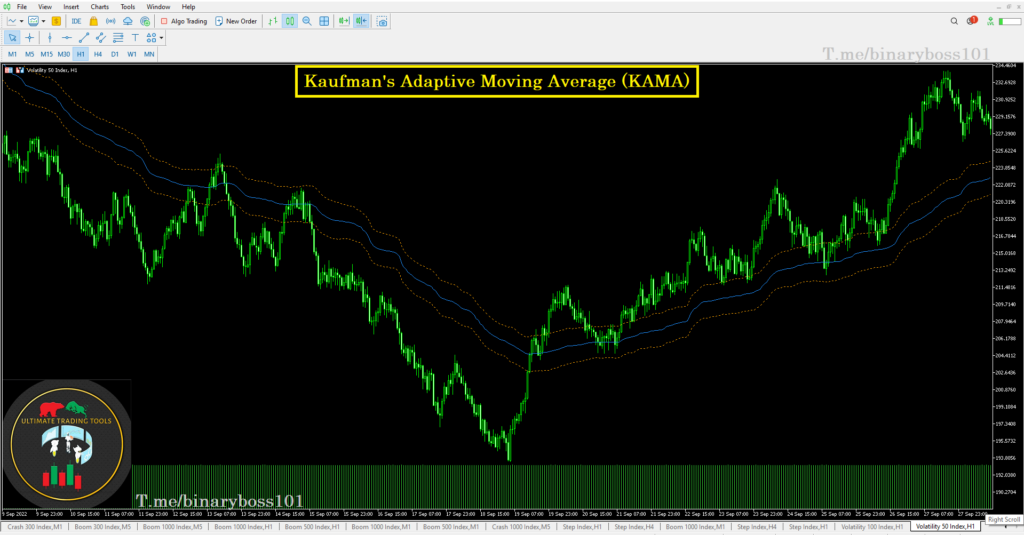
Kaufman’s Adaptive Moving Average (KAMA):
- Platform: Meta-Trader 5
- Supported Pairs: All Forex Markets & synthentic Index
- Trading Time : Any Time of Day.
- Time-Frame: 1 Hour and Above
- Recommended Broker: Deriv .app/ MT5 Platform?
- Double Click to Load & Attach the Indicator on MT5 Platform.
- Platform: Meta-Trader 5
- Supported Pairs: All Forex Markets & synthentic Index
- Trading Time : Any Time of Day.
- Time-Frame: 1 Hour and Above
- Recommended Broker: Deriv .app/ MT5 Platform?
- Double Click to Load & Attach the Indicator on MT5 Platform.
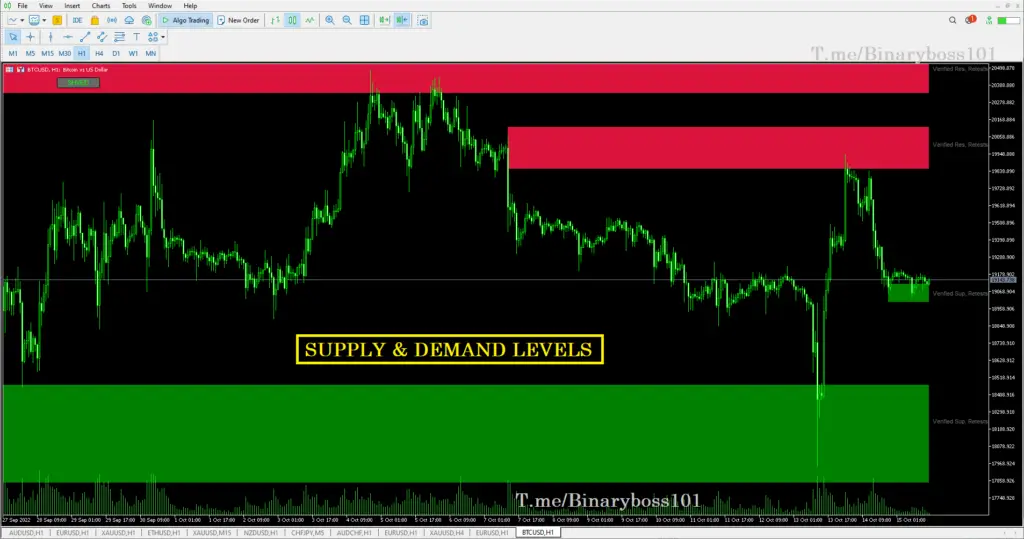
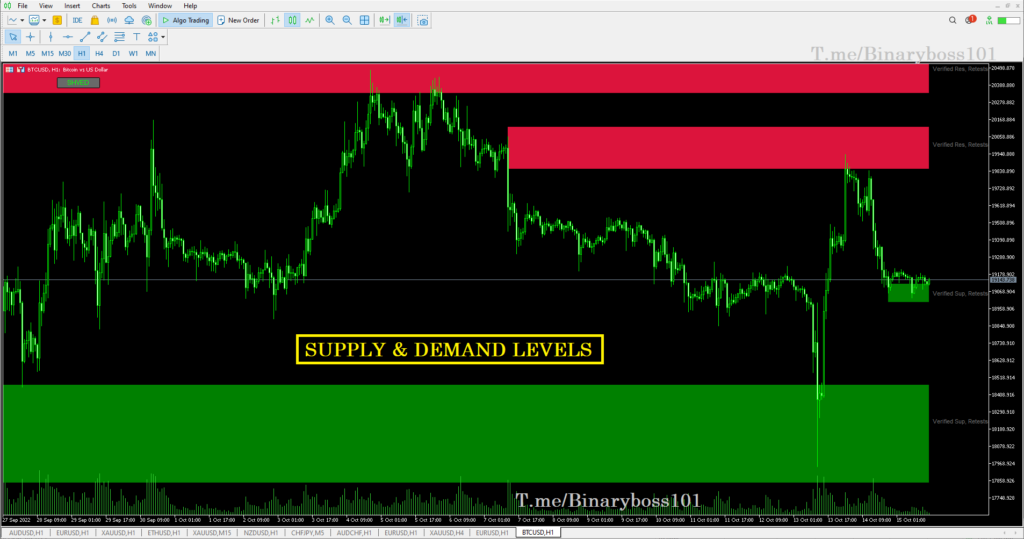
How To Apply on Chart? These zones are very simple to use. When The price reaches these zone, you can look for your favorite setup or Price Action setup for entry signal. These zone provides very good risk to reward ratio. The basic rule is to buy at supply zone and sell at demand zone given that price action is confirming the entry.
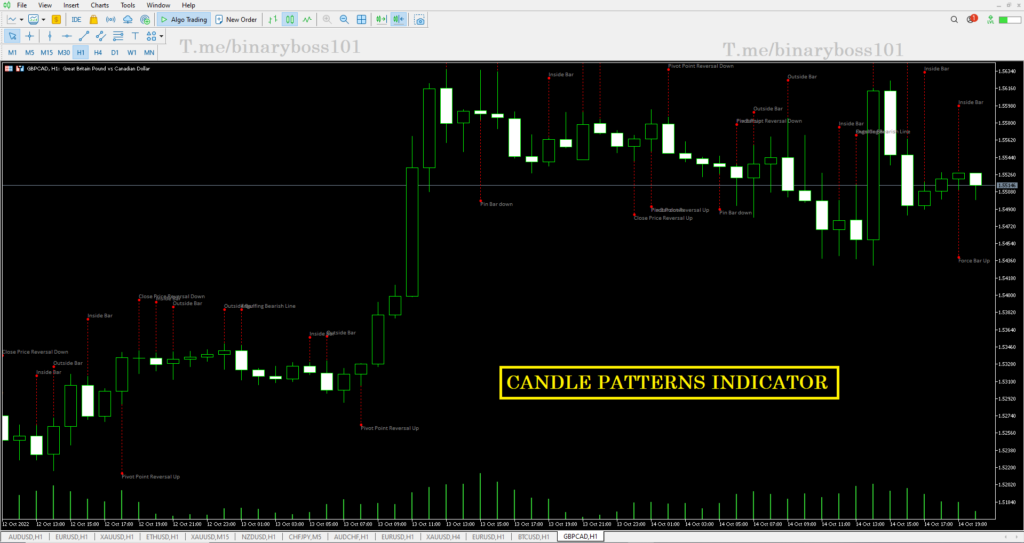
Candle Patterns MT5 Indicator:
- Platform: Meta-Trader 5
- Supported Pairs: All Forex Markets & synthentic Index
- Trading Time : Any Time of Day.
- Time-Frame: 1 Hour and Above
- Recommended Broker: Deriv .app/ MT5 Platform?
- Double Click to Load & Attach the Indicator on MT5 Platform.
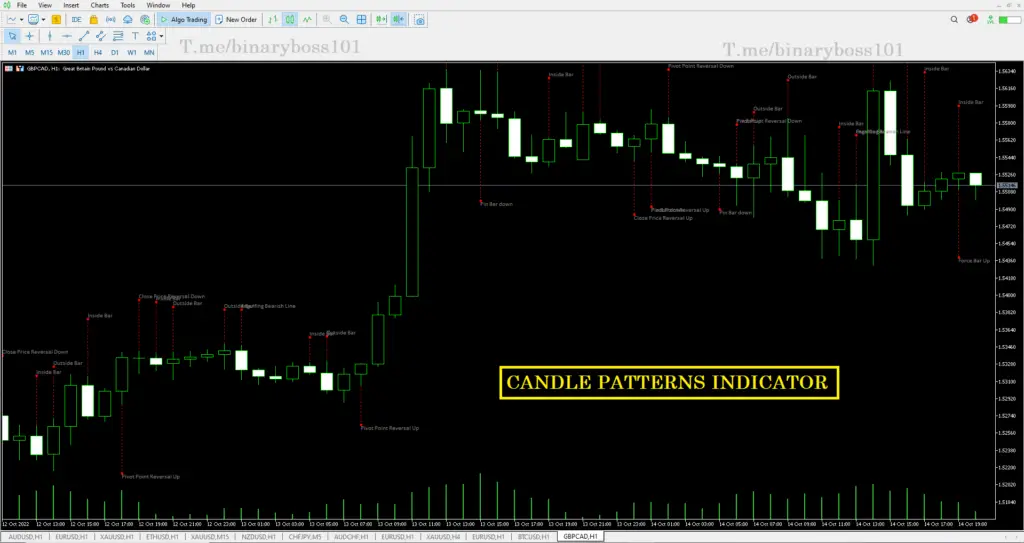
Hows its Used? The Candle Patterns indicator for MT5 will help Traders to easily identify all the trading patterns associated with any strategy. Finally, the indicator is free to download.
WATR MT5 Indicator:
- Platform: Meta-Trader 5
- Supported Pairs: All Forex Markets Metal, oils & synthentic Index
- Trading Time : Any Time of Day.
- Time-Frame: 1 Hour and Above
- Recommended Broker: Deriv .app/ MT5 Platform?
- Double Click to Load & Attach the Indicator on MT5 Platform.
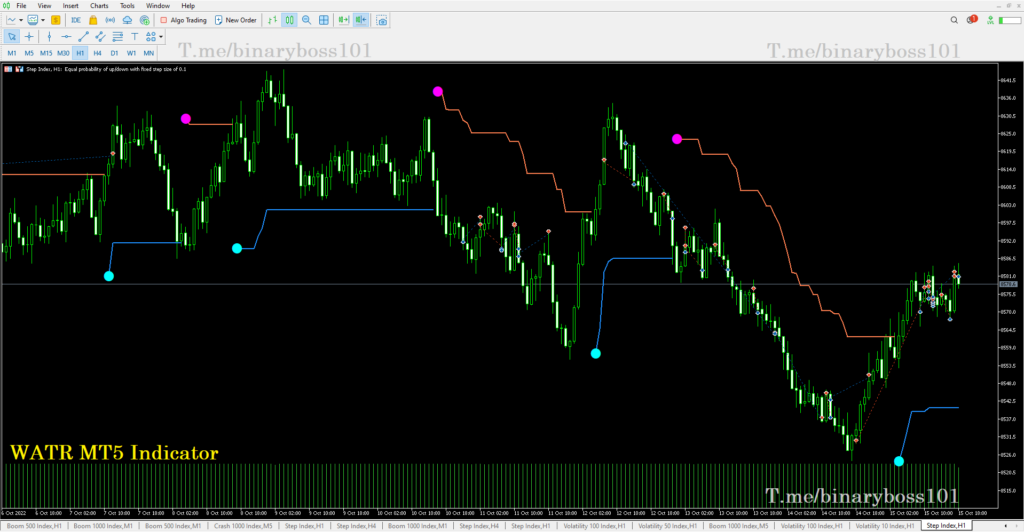
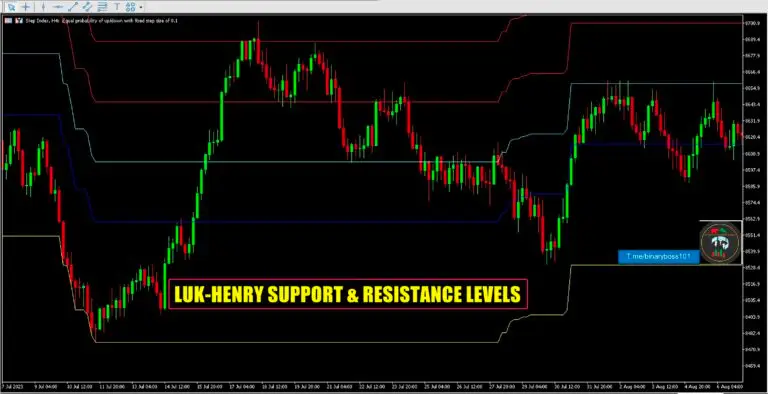
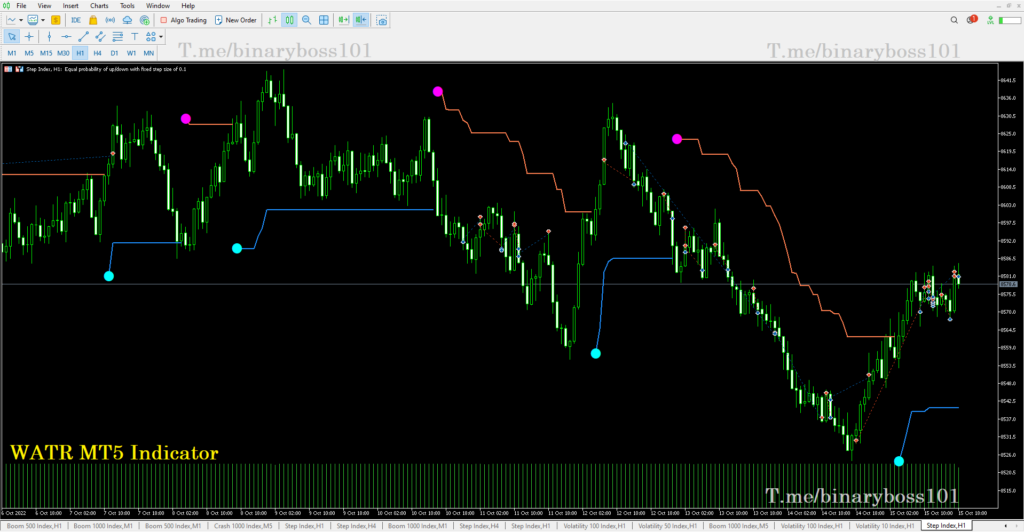
How to Use & Apply the WATR Indicator: The technical indicator generates blue (For Buy) and coral lines (For Sell) along the price depending on the direction of the price, as well as aqua and majenta circles at the best trade entry points.

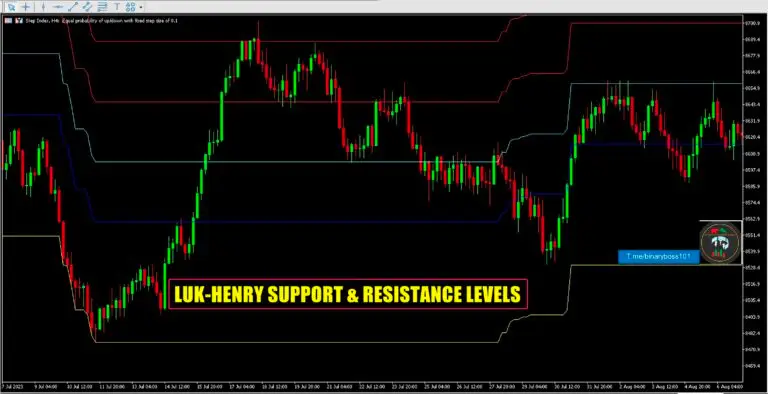
The indicator will spot support and resistance levels with which the price has actively interacted before.
The price range (height) of support or resistance areas depends on the spread between price highs and lows that the level goes through.
Resistance levels are marked in Red, and support levels are marked in Blue & Brown Levels. The Light Blue Middle Line is The Equillibrium Price. When Price Breaks Above, It Indicates Up-Trend, When Price Breaks Below, It Indicates, Down-Trend.
The Support&Resistance indicator does not repaint. However, the occurrence of new highs/lows within the range of a specific support/resistance can expand its height.
The best timeframes to work with are M15-H1.
How to Use :-
Load The Indicator on Deriv – MT5 Platform: Wait For Price Retest or Break-out of The Zones.
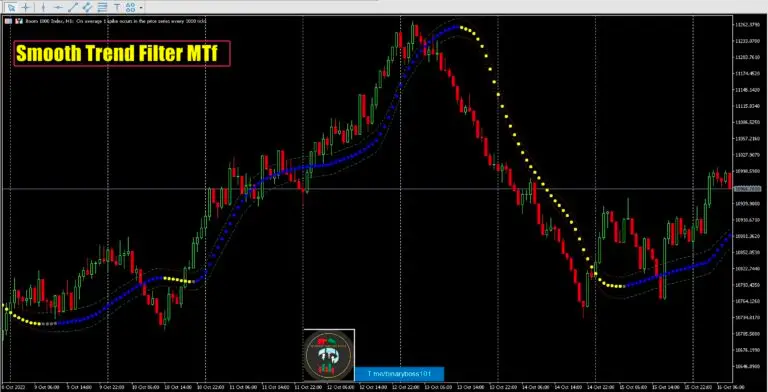
Smooth Trend Filter
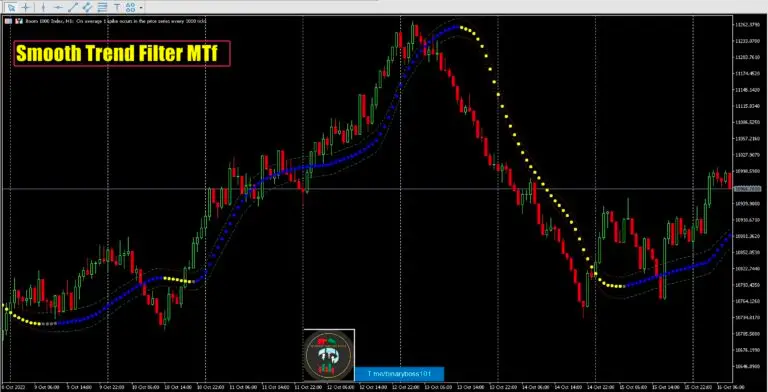
The Adaptive Jurik Filter is a technical analysis tool designed to filter out market noise and identify trends in financial markets, particularly in forex trading. Developed by Mark Jurik, the Adaptive Jurik Filter utilizes a complex algorithm that adjusts to changes in market conditions and volatility, making it an effective tool for traders looking to minimize false signals and improve their trading performance. This filter is particularly useful for forex traders who need to identify trends in a market that is often characterized by high volatility and rapid price movements. In this way, the Adaptive Jurik Filter helps traders to make more informed trading decisions and improve their overall profitability in the forex market.
How to Use:- Download Meta-Trader 5 Platform From Deriv .com
Adaptive Trend Filter Strategy
Here is a potential strategy using the Adaptive Jurik Filter for forex trading: Recommended Time-Frame is 1-Minute to 4 Hours
- Identify the trend: The first step in using the Adaptive Jurik Filter is to identify the trend in the forex market. The filter helps to identify the trend by filtering out market noise and providing a clear signal based on price movements. Look for the Adaptive Jurik Filter to change color to indicate a trend change.
- Confirm the trend: Once the Adaptive Jurik Filter has identified a potential trend, it’s important to confirm it with technical indicators or analysis tools. Consider using tools such as moving averages, MACD, or RSI to confirm the trend and ensure that it is valid.
- Enter the trade: Once you have identified and confirmed the trend, it’s time to enter the trade.
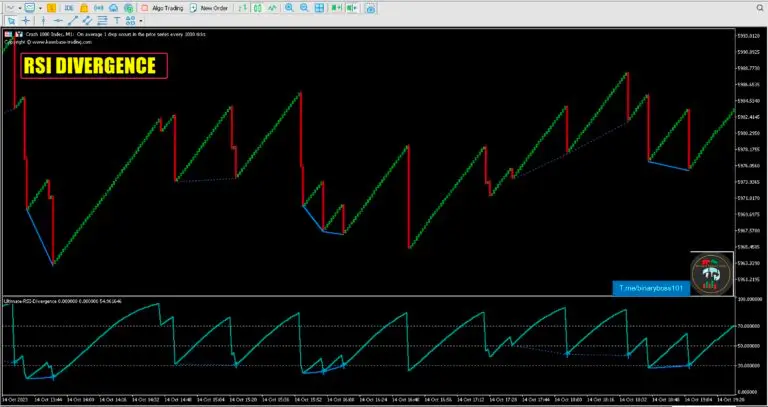
RSI_Divergence (With Alert)
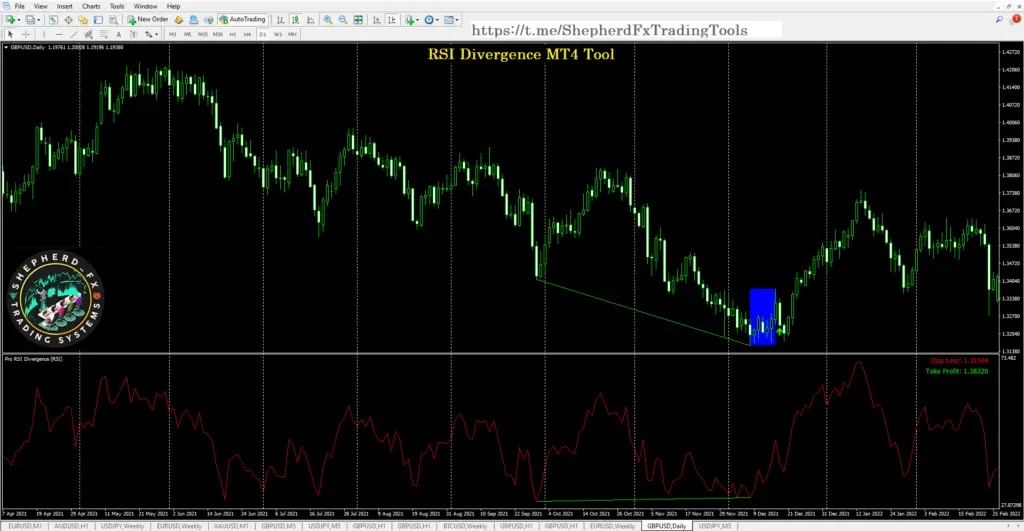
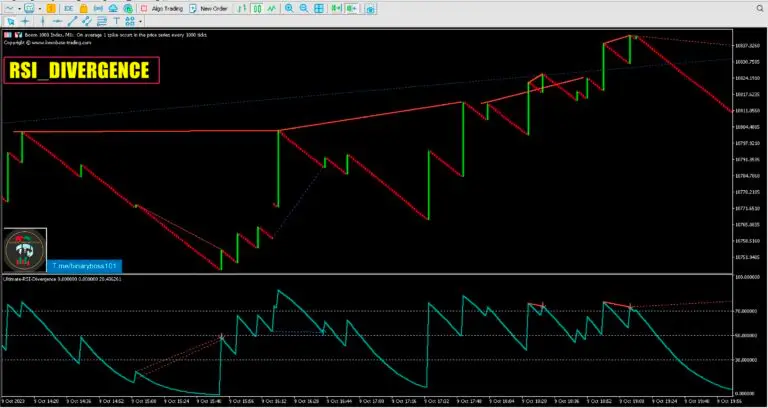
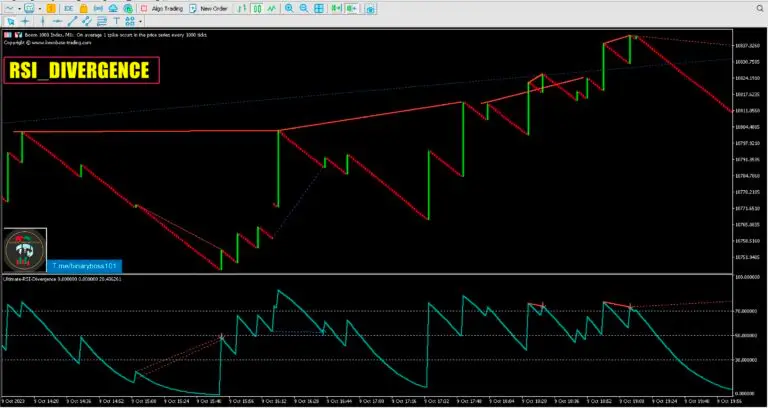
Ultimate RSI Divergence indicator MT4/MT5 shows the regular and hidden divergences built between the price and Relative Strength Index (RSI) oscillator.
Divergence can depict the upcoming price reversals, but manually spotting the divergence between price and oscillator is not an easy task.
- Positive Divergence: The price makes the lower lows, but RSI makes the higher lows. The phenomenon is also known as bullish divergence.
- Negative Divergence: The price makes the higher high, but RSI makes the lower high. The phenomenon is also known as bearish divergence.
Features
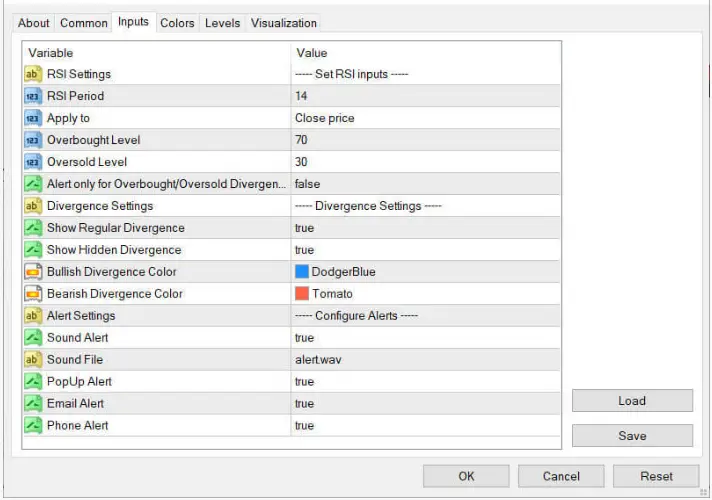
- Ability to choose the alerts only for the divergences that occur within an overbought/oversold level.
- Irregular divergences are discarded for better accuracy and lesser clutter.
- It can detect both regular and hidden divergences.
- Support trading strategies for trend reversal and trend continuation.
- Fully compatible for embedding into Expert Advisors.
- You can use it for the entries as well as for exits.
- It works equally well in smaller time frames for short-term trading.
- All Metatrader alerts are available.
Indicator Settings
The RSI has a fixed range from 0 to 100. Usually, the market is considered overbought if the RSI is above 70 and oversold if the RSI is below 30. However, we can experiment with different levels to capture the market phase more accurately.
The buy signals within the oversold zone and short trade within the overbought zone are considered the most vital signals.
The RSI can also be used to identify the market trend. The RSI above 50 is usually considered the Uptrend and below 50 is regarded as the downtrend.
Applications of RSI Divergence Indicator MT5 | MT4
- You can use the RSI divergence signals for generating buy and sell signals.
- You can use the divergence anchor points to place a stop-loss.
- The divergence signals can enhance the other trading strategies.
- It works really well when used with a 200-period moving average.
- It can pinpoint the upcoming reversal in the Daily time frame with high precision.
Limitations
Using the RSI divergence as a standalone entry signal can be risky. Every divergence signal can’t be interpreted as a strong reversal. Combining trading signals with price action and trend direction is best to achieve more accuracy.
We need two completed bars to the right side of the swing high/low to confirm a divergence signal. Sometimes, waiting for the two completed bars can delay trade entry to a greater extent.
Also, the divergence signals can fail drastically during a strong trending market. Therefore, it’s best to avoid trading the divergence signals against the primary trend or high-impact economic news.
What is a Divergence exactly?
In technical analysis, when the price is making higher highs, then the oscillator should also be making higher highs. The oscillator should also make lower lows if the price makes lower lows.
When this expected behavior is not followed, the price chart and oscillator diverge. There are two types of divergence:
Regular Divergence
- Regular Bullish Divergence: When the price makes lower lows, the oscillator makes higher lows.
- Regular Bearish Divergence: When the price is making higher highs, but the oscillator is making lower highs.
Hidden Divergence
- Hidden Bullish Divergence: If the price is making higher lows, but the oscillator is making lower lows.
- Hidden Bearish Divergence: The oscillator is making higher highs if the price makes the lower highs.
“Regular divergence is used to identify the trend reversals, and hidden divergence is used to determine the trend continuation.”
Bullish & Bearish Power Pennant Pattern.
The RSI has a fixed range from 0 to 100. Usually, the market is considered overbought if the RSI is above 70 and oversold if the RSI is below 30. However, we can experiment with different levels to capture the market phase more accurately.
The buy signals within the oversold zone and short trade within the overbought zone are considered the most vital signals.
The RSI can also be used to identify the market trend. The RSI above 50 is usually considered the Uptrend and below 50 is regarded as the downtrend.
Applications of RSI Divergence Indicator MT5 | MT4
- You can use the RSI divergence signals for generating buy and sell signals.
- You can use the divergence anchor points to place a stop-loss.
- The divergence signals can enhance the other trading strategies.
- It works really well when used with a 200-period moving average.
- It can pinpoint the upcoming reversal in the Daily time frame with high precision.
Limitations
Using the RSI divergence as a standalone entry signal can be risky. Every divergence signal can’t be interpreted as a strong reversal. Combining trading signals with price action and trend direction is best to achieve more accuracy.
We need two completed bars to the right side of the swing high/low to confirm a divergence signal. Sometimes, waiting for the two completed bars can delay trade entry to a greater extent.
Also, the divergence signals can fail drastically during a strong trending market. Therefore, it’s best to avoid trading the divergence signals against the primary trend or high-impact economic news.
What is a Divergence exactly?
In technical analysis, when the price is making higher highs, then the oscillator should also be making higher highs. The oscillator should also make lower lows if the price makes lower lows.
When this expected behavior is not followed, the price chart and oscillator diverge. There are two types of divergence:
Regular Divergence
- Regular Bullish Divergence: When the price makes lower lows, the oscillator makes higher lows.
- Regular Bearish Divergence: When the price is making higher highs, but the oscillator is making lower highs.
Hidden Divergence
- Hidden Bullish Divergence: If the price is making higher lows, but the oscillator is making lower lows.
- Hidden Bearish Divergence: The oscillator is making higher highs if the price makes the lower highs.
“Regular divergence is used to identify the trend reversals, and hidden divergence is used to determine the trend continuation.”
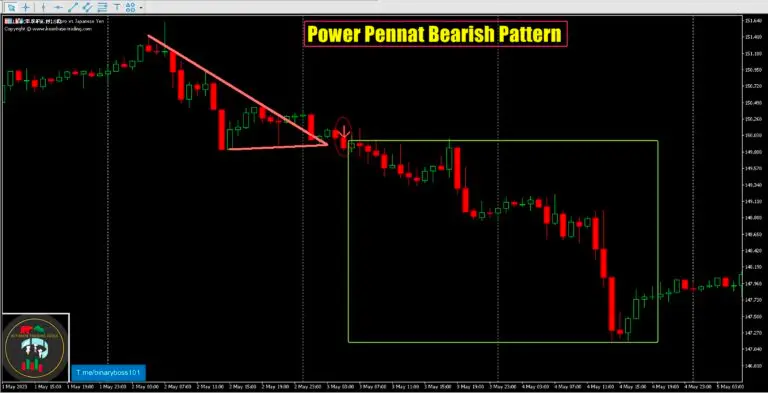
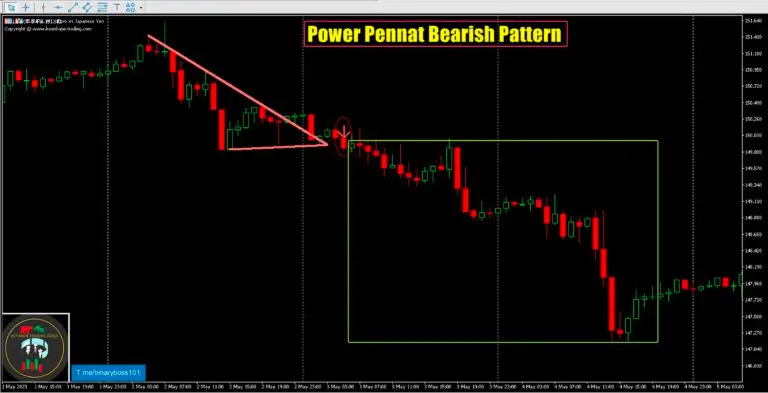
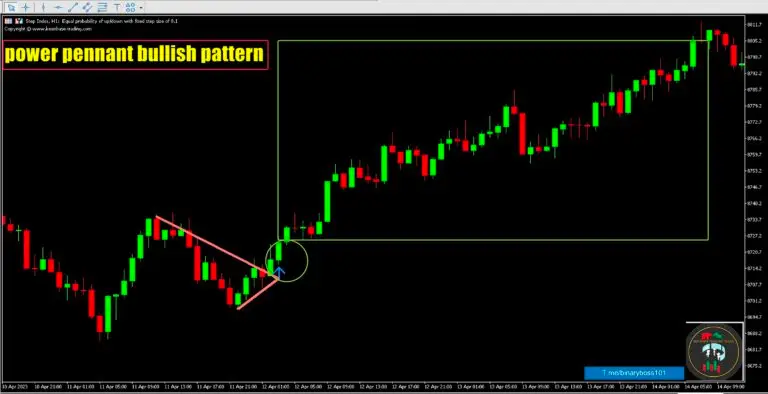
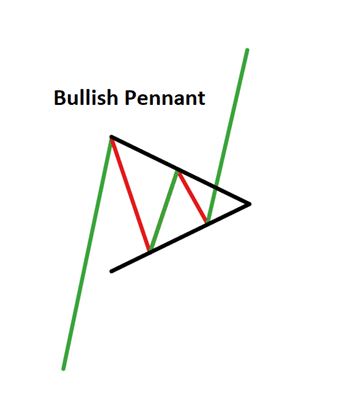
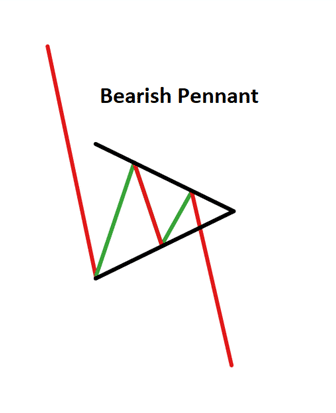
Power Pennant Pattern indicator MT5 finds and marks the famous pennant pattern on the chart. A pennant is a trend continuation pattern with a significant price movement in one direction, followed by a period of consolidation with converging trend-lines.
Once a pennant pattern is formed, a buy/sell signal is provided using a bullish or bearish breakout after the pattern formation.
Features
- Pennant patterns provide a low-risk entry after a period of consolidation, followed by a breakout.
- When combined with other methods of technical analysis, the signals provided by the KT Power Pennant pattern indicator can be advantageous.
- Consolidation period with lower volume followed by a breakout with increasing volumes provides a high chance of price continuation in trend direction.
- All Metatrader alerts implemented.
Bullish Pennant Pattern
Bearish Pennant Pattern
Input Parameters of Power Pennant Pattern indicator
- History Bars: The number of bars to find historical pennant patterns.
- Pattern Magnitude: An integer value that decides the pennant pattern magnitude and size.
- Pattern Formation Color: The color of trend-lines that form the pattern.
- Pattern Formation Width: The width of trend-lines that from the pattern.
- The rest of the inputs are self explanatory.
TREND PULL-BACK SIGNAL.
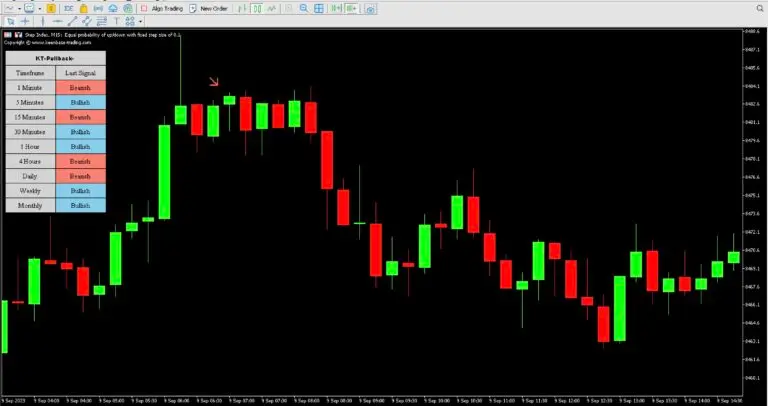
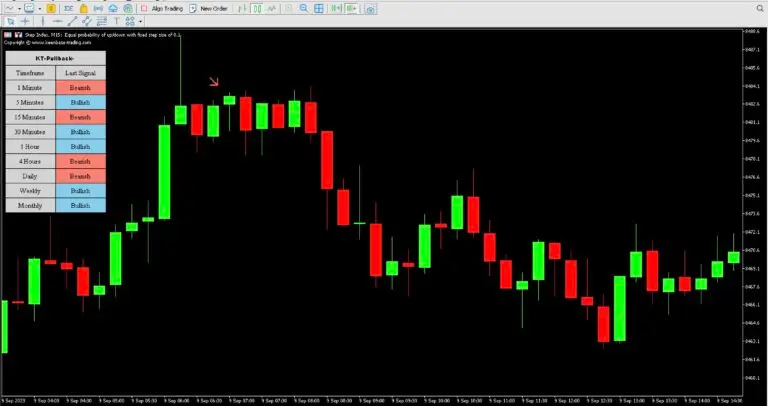
The Pull Back indicator MT5 shows the pull back arrows using the RSI (Relative Strength Index) to identify suitable pull-back entry areas within the overbought and oversold zones.
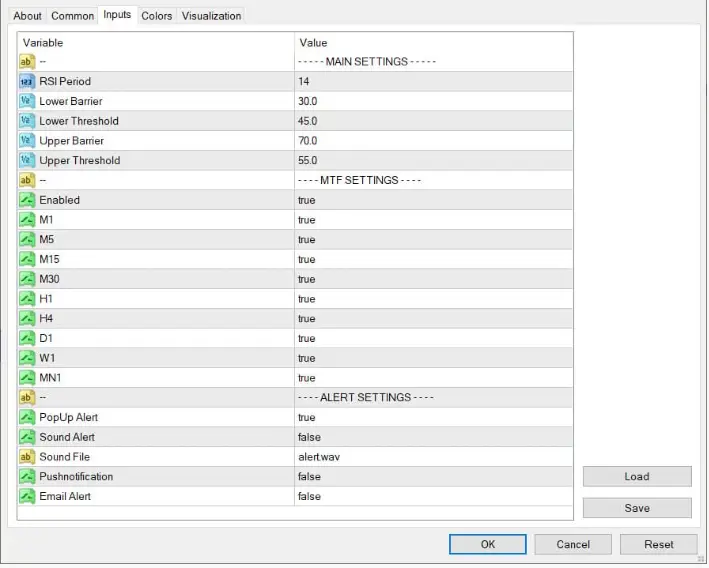
Inputs.
The Pullback Arrows
The Pullback indicator show the green and red Up and Down arrows.
A green arrow indicates a high probability of upcoming pullback after a bullish retracement.
A red arrow indicates a high probability of upcoming pullback after a bearish retracement.
For instance, if you are trading the EUR/GBP currency pair on a 4-hour timeframe.
If the Pullback indicator shows a green or red arrow, the chances of the retracement ending are high.
This indicator is a boon for swing traders and position traders who operate on hourly, daily, weekly, and monthly time frames.
Features
Pullback RSI Values
You can customize the RSI values to adjust the pullback detection according to a particular instrument and timeframe.
Applicable to Both Long and Short Trades
This indicator can be used for both long and short trades.
It can help identify when an uptrend is likely to continue (for long trades) or when a downtrend is likely to resume (for short trades).
Trend Direction Identification
The trend direction identification feature works by analyzing the retracement values in relation to the overall market movement.
Versatility
The indicator can be used on any instrument your trading platform offers, including FX pairs, Gold, Silver, Indices, Futures, Stocks, etc.
This makes it a versatile tool for various trading scenarios. On All Timeframes