MT5 TRADING TOOLS
Technical MT5 indicators examine MetaTrader 5 price charts for the Forex market, stock market, and commodities market. Indicators identify the strength and direction of trends, overbought and oversold conditions, and levels of support and resistance. The underlying mathematical models offer an unbiased evaluation of the situation of the market, enabling traders to accept or reject the signals from trading systems. Download and Create Your Own Trading Systems Using These Freee MT5 Indicators.
Correlation Angle MT5 Indicator:
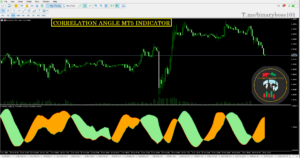
The Correlation Angle MT5 Indicator offers the chance to identify distinct anomalies and patterns in price dynamics that are hidden from plain sight.
- Platform: Meta-Trader 5
- Supported Pairs: Currencies, Metals, Synthentic Index
- Trading Time : Any Time of Day.
- Time-Frame: 1 Minutes to 4 Hours
- Recommended Broker: Deriv .app/ MT5 Platform?
Regression Channel with variable polynomial Trend MT5 Indicator:
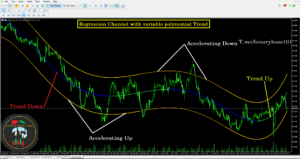
Large institutions, like the 200-day moving average, frequently examine long-term linear regression channels.
A linear regression channel is made up of three components:
Linear Regression Line – The line that best fits all of the data points.
Upper Channel Line – A line that runs parallel to the Linear Regression Line and is usually one to two standard deviations above it.
Lower Channel Line – This line runs parallel to the Linear Regression Line and is typically one to two standard deviations lower.
- Platform: Meta-Trader 5
- Supported Pairs: Currencies, Stocks, Oils, Metals, Synthentic Index
- Trading Time : Any Time of Day.
- Time-Frame: 1 & Above
- Recommended Broker: Deriv .app/ MT5 Platform?
Forex Market Hours GMT MT5 Indicator:
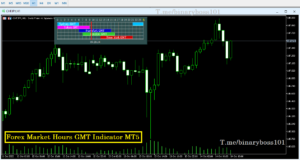
- Platform: Meta-Trader 5
- Supported Pairs: All Forex Markets
- Trading Time : Any Time of Day.
- Time-Frame: Any
- Recommended Broker: Deriv .app/ MT5 Platform?
Trix Arrows 2.0 MT5 Indicator:

- Platform: Meta-Trader 5
- Supported Pairs: All Forex Markets & synthentic Index
- Trading Time : Any Time of Day.
- Time-Frame: Any
- Recommended Broker: Deriv .app/ MT5 Platform?
The TRIX Arrows Metatrader 5 indicator is an excellent tool for filtering noise when trading in the Forex market. Spikes or unexpected market fluctuations are the most common cause of losses in forex and index trading. Combining TRIX and TEMA to create a technical trading strategy, on the other hand, provides much better signals for forex and index traders because they use exponential moving averages. The indicator is simple to download and install, and traders can tweak the settings to achieve the best trading results possible.
Fibonacci + Pivot MT5 Combined Indicator:
- Platform: Meta-Trader 5
- Supported Pairs: All Forex Markets & synthentic Index
- Trading Time : Any Time of Day.
- Time-Frame: 1 Hour and Above
- Recommended Broker: Deriv .app/ MT5 Platform?
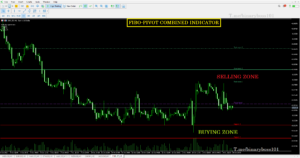
Fibonacci ratios are also essential when it comes to formulating highly relevant support and resistance levels in the markets that trading assets most frequently adhere to – so this indicator is a robust and reliable resource to have when it comes to having key and strong support and resistance zones drawn automatically for all traders. At any given time, there are always a total of seven lines displayed relative to the Pivot points indicator – the fundamental pivot line is purple, the support lines are found below the main pivot line, which is red, and the three green resistance pivot lines are found above the main purple pivot line. Download For Free & Test for Your-self.
Ozymandias MT5 System With Alert:
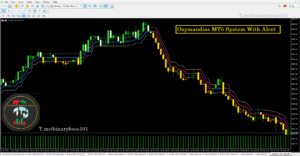
- Platform: Meta-Trader 5
- Supported Pairs: All Forex Markets & synthentic Index
- Trading Time : Any Time of Day.
- Time-Frame: 1 Hour and Above
- Recommended Broker: Deriv .app/ MT5 Platform?
- Double Click to Load & Attach the Indicator on MT5 Platform.
Kaufman’s Adaptive Moving Average (KAMA):
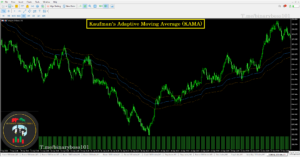
- Platform: Meta-Trader 5
- Supported Pairs: All Forex Markets & synthentic Index
- Trading Time : Any Time of Day.
- Time-Frame: 1 Hour and Above
- Recommended Broker: Deriv .app/ MT5 Platform?
- Double Click to Load & Attach the Indicator on MT5 Platform.
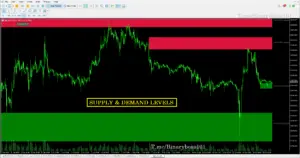
It’s Based on historical price activity and probability, it displays both strong and weak zones.
- Platform: Meta-Trader 5
- Supported Pairs: All Forex Markets & synthentic Index
- Trading Time : Any Time of Day.
- Time-Frame: 1 Hour and Above
- Recommended Broker: Deriv .app/ MT5 Platform?
- Double Click to Load & Attach the Indicator on MT5 Platform.
How To Apply on Chart? These zones are very simple to use. When The price reaches these zone, you can look for your favorite setup or Price Action setup for entry signal. These zone provides very good risk to reward ratio. The basic rule is to buy at supply zone and sell at demand zone given that price action is confirming the entry.
Candle Patterns MT5 Indicator:

The most ideal way to use the indicator is to select a BUY/SELL setup that is displayed at pivot levels such as support/resistance levels and Fibonacci levels. Moreover, you can also use the price action in sync with the indicator for a better trade entry. This is shown in the screenshot above, which shows trade setups after engulfing candlestick patterns.
- Platform: Meta-Trader 5
- Supported Pairs: All Forex Markets & synthentic Index
- Trading Time : Any Time of Day.
- Time-Frame: 1 Hour and Above
- Recommended Broker: Deriv .app/ MT5 Platform?
- Double Click to Load & Attach the Indicator on MT5 Platform.
Hows its Used? The Candle Patterns indicator for MT5 will help Traders to easily identify all the trading patterns associated with any strategy. Finally, the indicator is free to download.
WATR MT5 Indicator:
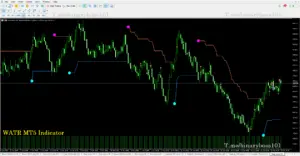
The Shared Version WATR indicator focuses on recent price changes and reacts quickly to changes in price behavior.
- Platform: Meta-Trader 5
- Supported Pairs: All Forex Markets Metal, oils & synthentic Index
- Trading Time : Any Time of Day.
- Time-Frame: 1 Hour and Above
- Recommended Broker: Deriv .app/ MT5 Platform?
- Double Click to Load & Attach the Indicator on MT5 Platform.
How to Use & Apply the WATR Indicator: The technical indicator generates blue (For Buy) and coral lines (For Sell) along the price depending on the direction of the price, as well as aqua and majenta circles at the best trade entry points.
