MBullish & Bearish Power Pennant Pattern
The RSI has a fixed range from 0 to 100. Usually, the market is considered overbought if the RSI is above 70 and oversold if the RSI is below 30. However, we can experiment with different levels to capture the market phase more accurately.
The buy signals within the oversold zone and short trade within the overbought zone are considered the most vital signals.
The RSI can also be used to identify the market trend. The RSI above 50 is usually considered the Uptrend and below 50 is regarded as the downtrend.
Applications of RSI Divergence Indicator MT5 | MT4
- You can use the RSI divergence signals for generating buy and sell signals.
- You can use the divergence anchor points to place a stop-loss.
- The divergence signals can enhance the other trading strategies.
- It works really well when used with a 200-period moving average.
- It can pinpoint the upcoming reversal in the Daily time frame with high precision.
Limitations
Using the RSI divergence as a standalone entry signal can be risky. Every divergence signal can’t be interpreted as a strong reversal. Combining trading signals with price action and trend direction is best to achieve more accuracy.
We need two completed bars to the right side of the swing high/low to confirm a divergence signal. Sometimes, waiting for the two completed bars can delay trade entry to a greater extent.
Also, the divergence signals can fail drastically during a strong trending market. Therefore, it’s best to avoid trading the divergence signals against the primary trend or high-impact economic news.
What is a Divergence exactly?
In technical analysis, when the price is making higher highs, then the oscillator should also be making higher highs. The oscillator should also make lower lows if the price makes lower lows.
When this expected behavior is not followed, the price chart and oscillator diverge. There are two types of divergence:
Regular Divergence
- Regular Bullish Divergence: When the price makes lower lows, the oscillator makes higher lows.
- Regular Bearish Divergence: When the price is making higher highs, but the oscillator is making lower highs.
Hidden Divergence
- Hidden Bullish Divergence: If the price is making higher lows, but the oscillator is making lower lows.
- Hidden Bearish Divergence: The oscillator is making higher highs if the price makes the lower highs.
“Regular divergence is used to identify the trend reversals, and hidden divergence is used to determine the trend continuation.”

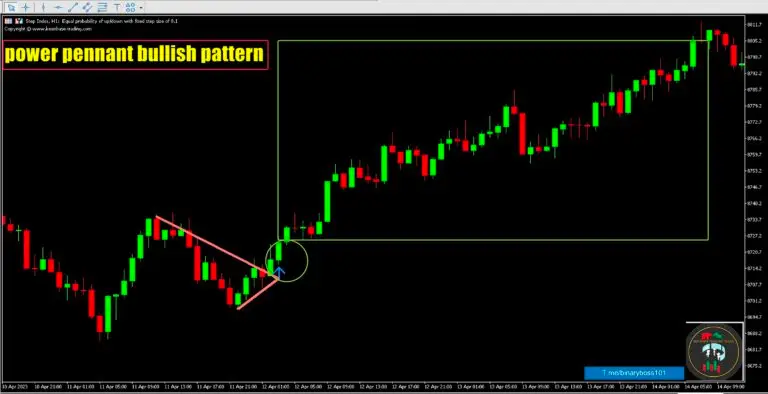
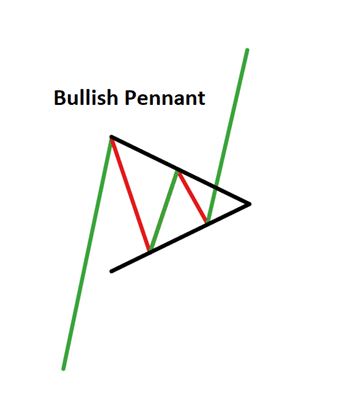
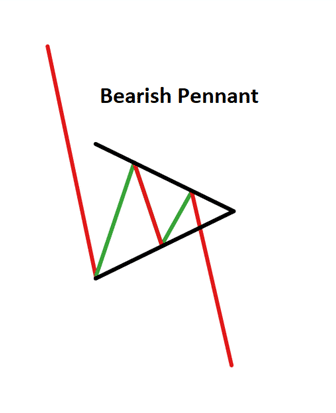
Power Pennant Pattern indicator MT5 finds and marks the famous pennant pattern on the chart. A pennant is a trend continuation pattern with a significant price movement in one direction, followed by a period of consolidation with converging trend-lines.
Once a pennant pattern is formed, a buy/sell signal is provided using a bullish or bearish breakout after the pattern formation.
Features
- Pennant patterns provide a low-risk entry after a period of consolidation, followed by a breakout.
- When combined with other methods of technical analysis, the signals provided by the KT Power Pennant pattern indicator can be advantageous.
- Consolidation period with lower volume followed by a breakout with increasing volumes provides a high chance of price continuation in trend direction.
- All Metatrader alerts implemented.
Bullish Pennant Pattern

Bearish Pennant Pattern

Input Parameters of Power Pennant Pattern indicator
- History Bars: The number of bars to find historical pennant patterns.
- Pattern Magnitude: An integer value that decides the pennant pattern magnitude and size.
- Pattern Formation Color: The color of trend-lines that form the pattern.
- Pattern Formation Width: The width of trend-lines that from the pattern.
- The rest of the inputs are self explanatory.