The indicator will spot support and resistance levels with which the price has actively interacted before.
The price range (height) of support or resistance areas depends on the spread between price highs and lows that the level goes through.
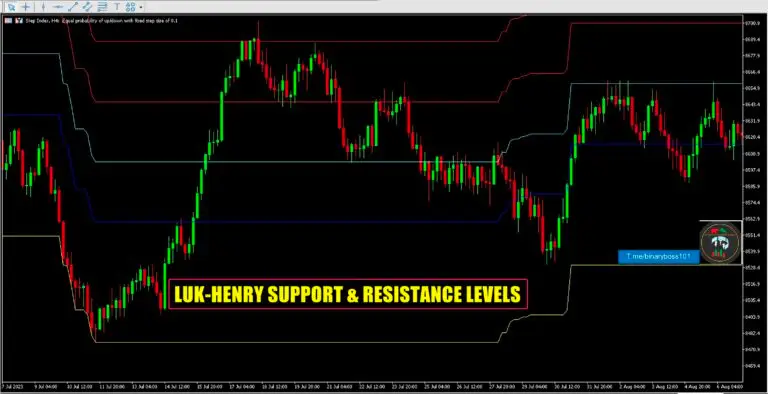
Resistance levels are marked in Red, and support levels are marked in Blue & Brown Levels. The Light Blue Middle Line is The Equillibrium Price. When Price Breaks Above, It Indicates Up-Trend, When Price Breaks Below, It Indicates, Down-Trend.
The Support&Resistance indicator does not repaint. However, the occurrence of new highs/lows within the range of a specific support/resistance can expand its height.
The best timeframes to work with are M15-H1.
How to Use :-
Load The Indicator on Deriv – MT5 Platform: Wait For Price Retest or Break-out of The Zones.