
Description
Draw a line at every swing high and low and the chart soon fills with levels, most of which price ignores. Buyers & Sellers Profile + Dynamic S/R keeps only the swings that the market’s own volume profile backs up. It builds a rolling profile to the right of price, splits every row into buyer and seller share, and checks each new swing against it: a support stays only if there is real buying activity near it, a resistance only if there is selling. Every level that survives carries a 0 to 100 score, and the indicator keeps a running record of how often levels in each score band have actually held on the symbol and timeframe in front of you.
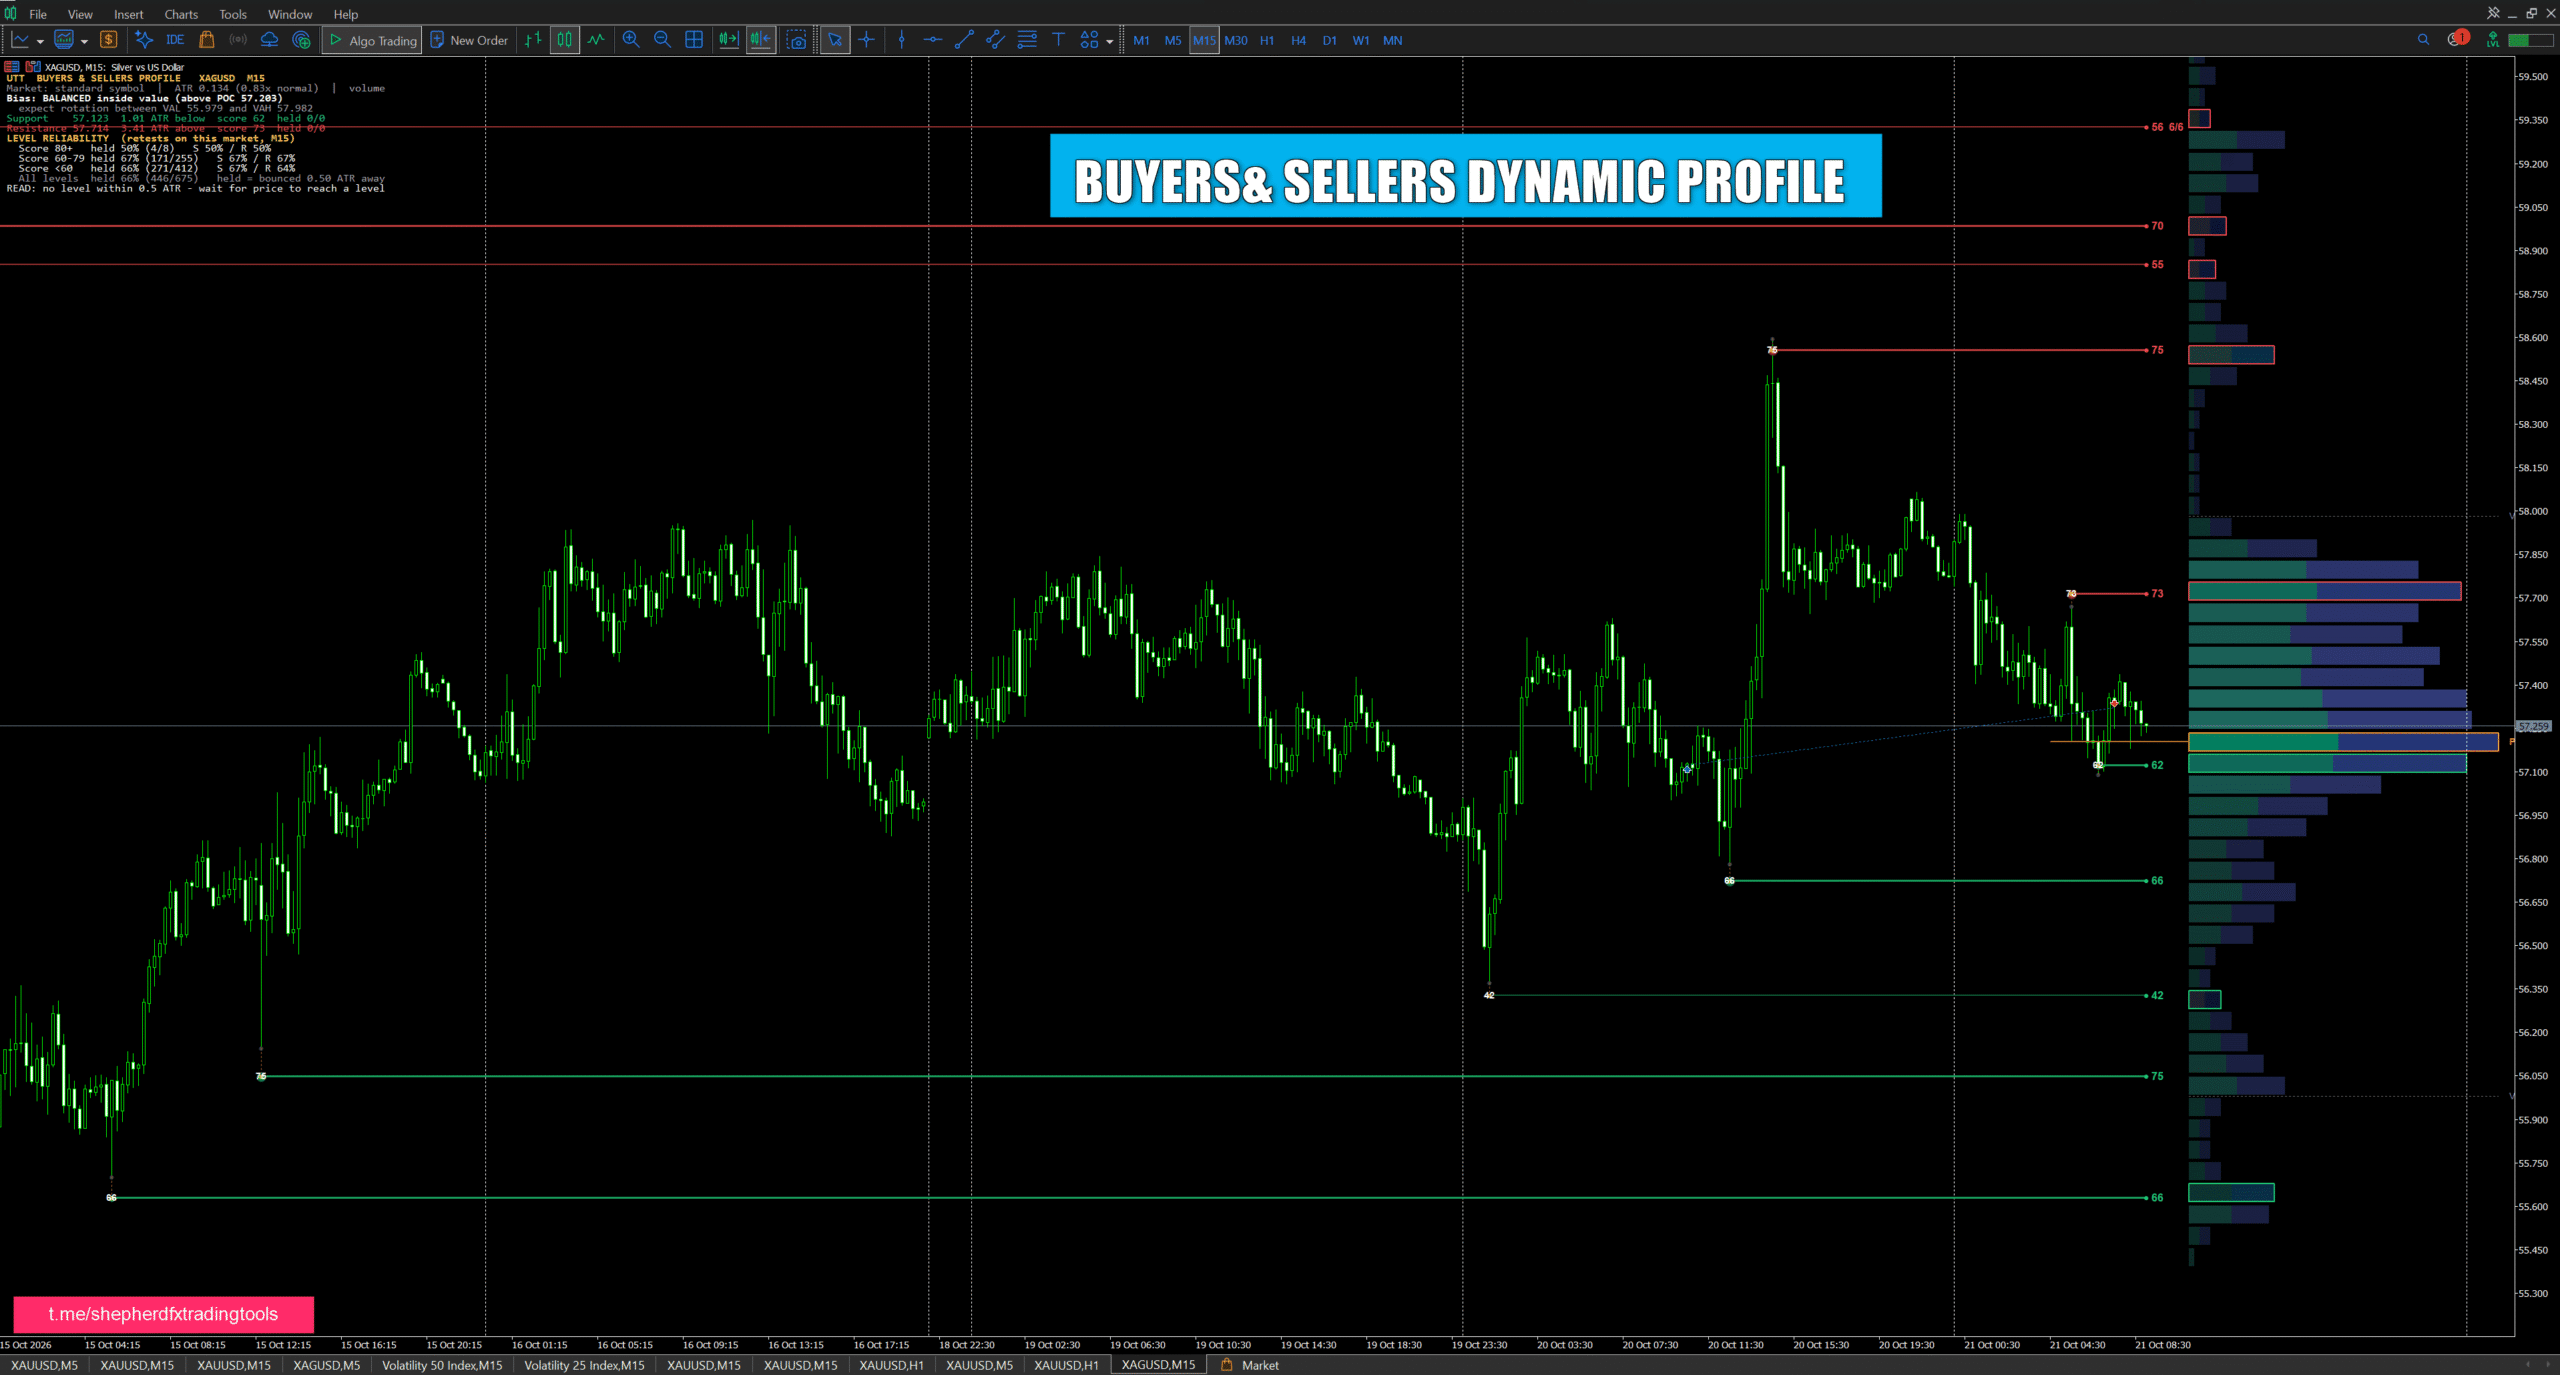
The profile spans 72 rows across a lookback set in minutes (9,000 by default, which is 600 bars on M15), so it covers the same stretch of time on every timeframe. It is built from lower-timeframe candles – M1 on charts up to H4 – so the distribution inside each chart candle is real rather than smeared across its range. Each row’s activity is split by where those candles closed and drawn as a teal buyer bar and a blue seller bar. The busiest row is the point of control (POC), outlined in orange, and the 70% of activity around it forms the value area, marked with VAH and VAL lines. Rows that hold an active level are outlined in green or red, so you can see at a glance which levels sit on heavy nodes.
A level starts as a swing high or low, confirmed five bars after it forms. The engine searches the profile within 1.2 ATR of the swing for the strongest node, weighing node strength against the POC, how far the row stands out from its neighbours, and whether buyers (for support) or sellers (for resistance) dominate it. If the evidence is strong enough, the level is pulled up to 85% of the way toward that node. Its score blends that profile evidence with absorption (small bodies on above-average activity around the swing), activity against its 40-bar average and the rejection wick. Nearby levels merge, only the 20 strongest are kept, and a level is removed when a candle closes through it by more than a tenth of an ATR.
Deriv synthetic indices need different handling, and this edition provides it. Tick volume on synthetics is constant – one tick every one or two seconds – so it says nothing about activity; on synthetics the volume weight becomes candle range plus body size instead. The market is read from the MT5 symbol description: Volatility indices are grouped calm, mid or fast by their volatility percentage, 1-second indices are recognised, and Boom, Crash, Step, Jump, Range Break and DEX each get their own search, merge and break distances. On Boom and Crash the break buffer is more than twice as wide on the spike side, so a single spike does not wipe out a level. Forex pairs, gold and silver keep tick volume and the standard settings.
Every time price comes back to an active level, the retest is recorded. It counts as held if price moves half an ATR away from the level before closing through it, and broken if it closes through first. The dashboard turns that into a reliability table for scores of 80 and above, 60 to 79 and below 60, split by support and resistance, so you can see whether a high score actually means something on your market. Above it, a bias line reads the profile in plain English – buyers in control above the value area, sellers in control below it, or balanced rotation between VAL and VAH – next to the nearest support and resistance with their distance in ATR, score and retest record. The last line says what price is doing now: testing a level, with that band’s hold rate and the close that would invalidate it, or nowhere near one yet.
Levels are evaluated on closed candles. Alerts for a new level, and for a support or resistance broken on a confirmed close, fire on live bars only – never for history when the indicator loads – by popup, push notification or sound, with an optional alert when price enters a level’s retest band. The nearest support, nearest resistance, POC, VAH and VAL are exposed as buffers for Expert Advisors through iCustom. It is built to stay steady on 1-second indices: no blinking while history loads, and it re-indexes itself when MT5 trims old bars.
Single self-contained .mq5 with no includes, plus a README covering installation, the market table, how levels are scored, every input and the buffer map. Free MT5 download. Educational tool, not financial advice.
Licence: this is an MQL5 port of the Pine Script v6 “Buyers & Sellers Profile + Dynamic S/R” by Zeiierman, released under Creative Commons Attribution-NonCommercial-ShareAlike 4.0 (CC BY-NC-SA 4.0). The port and its Deriv additions are shared free under the same licence, the original credit is kept in the source header, and the full .mq5 ships in the download.
Works well with Swing Failure Pattern – a wick that sweeps a high-score level and closes back inside is exactly the kind of reaction the reliability table counts.


Reviews
There are no reviews yet.